
Start today and double your
workforce in 90 days.
Same people, stronger execution.
Get more done, for better rates, and with less friction.

.png)
Unleash the power of your workforce.
.png)
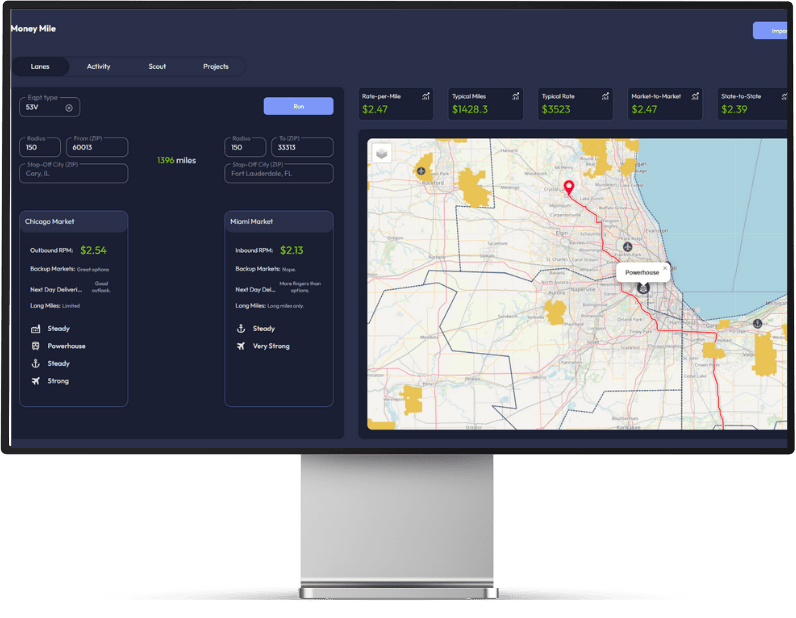
Get Better Rates
.png)
Get More Done
.png)
With Less Friction
When was the last time
you found the RC in 1 click?
.png)

your sheets cAN'T HAUL IT ALL.
See how 10-4 TMS compares to your Sheets Board.
Features
Simple and Easy to Use
See Driver's Weekly Route
See Rates in one Click
Search Loads
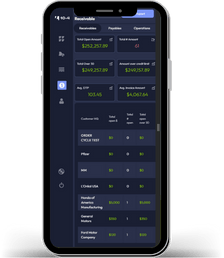
Automated Gross/Net Profit Reporting
Find a RateCon, BOL, HCPOD in a Click
Unlimited Comments
Automated RateCons
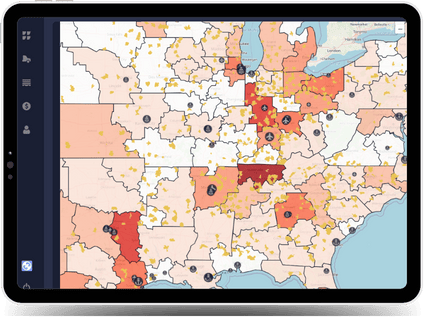
Search By Radius
Connected to Accounting
Your Sheets Board
Simple and Easy to Use

See Driver's Week
Search Loads

See Rates in a click
Automated Gross/Net Profit Reports
Find Paperwork:
(RateCon,
BOL,
HCPOD)
in One Click
(RateCon,
BOL,
HCPOD)
in One Click
Search by Radius
Branded RateCons
See all Empty driver in one click
Automated Miles

10-4: Dispatch Board
Simple and Easy to Use

See Driver's Week
Search Loads
See Rates in a click
Automated Gross/Net Profit Reports
Find Paperwork:
(RateCon,
BOL,
HCPOD)
in One Click
(RateCon,
BOL,
HCPOD)
in One Click
Search by Radius
Branded RateCons
See all Empty Drivers in one click
Automated Miles
And many, many more features
Split Load
Claim prevention
Load Timeline
Be the first one to lead the pack.
Experience what predictable
day-to-day looks like
before everyone else.